Logging is one of the most important aspects of working with production software. The complexity of Kubernetes doesn’t make that an easier task.
There are really great open source cloud-agnostic solutions, but those might not be a great fit for you if you don’t want to have to manage the solution as well as the Kubernetes cluster. This is one of the primary benefits of running your Kubernetes cluster in a cloud provider’s managed service (AKS, EKS, GKE, etc.).
If you want to quickly get to an Azure-native logging solution for your AKS cluster, it takes just a little guidance and a few switches.
Azure Monitor for containers
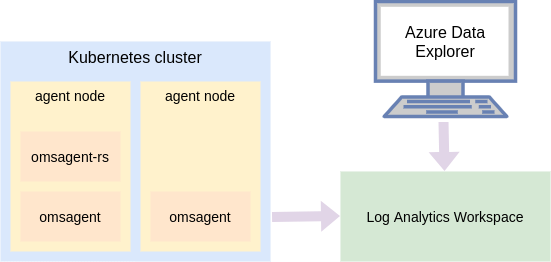
Azure Monitor for containers is a solution that includes a lot, but for this blog post I want to focus on a single feature of it: The ability to automatically transfer container logs to a Log Analytics workspace. When the log data is in the workspace we can use a number of tools to query the data, my favorite being the Azure Data Explorer web UI.
When you enable this on an AKS cluster, Azure Monitor creates a DaemonSet (omsagent) and a Deployment (omsagent-rs), which is what sends the log data from your containers output to the Log Analytics workspace.
Create your Log Analytics Workspace
The first (optional) step is to create a Log Analytics workspace. The reason why it is optional is because if we create our AKS cluster and don’t specify a workspace, then it’ll automatically create one for us. There are a handful of options when creating a Log Analytics workspace, which is why I think it is a good practice to create it manually to be intentional with those options.
1
2
3
$ az monitor log-analytics workspace create \
    --resource-group rg \
    --workspace-name workspace_name
Some notable options are public network access for ingestion and querying (--ingestion-access and --query-access). Another important one is the log retention time (--retention-time), which defaults to 30 days.
Another reason to create it manually and not rely on AKS to create it is that you can choose where you want it placed and how you want it named.
Create a monitoring-enabled AKS cluster
Before you can create the cluster, you need to make sure that you have a few providers registered first.
1
2
3
4
5
6
$ az provider show \
    --namespace "Microsoft.OperationsManagement" \
    --query registrationState -o tsv
$ az provider show \
    --namespace "Microsoft.OperationalInsights" \
    --query registrationState -o tsv
If either of those aren’t Registered then you can register them with az provider register --namespace <namespace>. Once those providers are registered you can create the cluster:
1
2
3
4
5
6
7
8
9
$ az aks create \
    --resource-group rg \
    --name aks_name \
    --enable-addons monitoring \
    --workspace-resource-id \
        $(az monitor log-analytics workspace show \
            --resource-group rg \
            --workspace-name workspace_name \
            --query id -o tsv)
…and that’s it! You now have an AKS cluster that is logging to a workspace for you to query. This includes container logs.
Sample workload
To see this in action, I created a sample workload:
deployment.yaml
1
2
3
4
5
6
7
8
9
10
11
12
13
14
15
16
17
18
19
apiVersion: apps/v1
kind: Deployment
metadata:
  name: logging-test
spec:
  replicas: 4
  selector:
    matchLabels:
      app: logtest
  template:
    metadata:
      labels:
        app: logtest
    spec:
      containers:
        - name: debian
          image: debian:latest
          command: ["/bin/bash"]
          args: ["-c", "while true; do echo hello world; sleep 10; done"]
This creates the desired pods:
1
2
3
4
5
6
$ kubectl get po
NAME                           READY   STATUS    RESTARTS   AGE
logging-test-d79d95bb7-4bd9j   1/1     Running   0          7h40m
logging-test-d79d95bb7-cjd4s   1/1     Running   0          7h40m
logging-test-d79d95bb7-h985f   1/1     Running   0          7h40m
logging-test-d79d95bb7-lgnwf   1/1     Running   0          7h40m
The logging output for a random pod is:
1
2
3
4
5
6
7
8
9
10
11
$ kubectl logs logging-test-d79d95bb7-4bd9j
hello world
hello world
hello world
hello world
hello world
hello world
hello world
hello world
hello world
...
Querying container data
You can query this data through the Azure Data Explorer web UI.
The first step is adding the cluster. You can click on the Add Cluster button on the left. The cluster URL is going to be https://ade.loganalytics.io prefixed by the workspace’s resource ID. Here’s a way to generate this URI:
1
$ echo "https://ade.loganalytics.io$(az monitor log-analytics workspace show -g rg -n workspace_name --query id -o tsv)"
You’ll get something that looks like:
1
https://ade.loganalytics.io/subscriptions/<subscription_id>/resourcegroups/<resource_group>/providers/microsoft.operationalinsights/workspaces/<workspace_name>
Once you connect to the workspace, you can write a query. The language to get data is the Kusto query language. The language details are out of the scope of this blog post, but I recommend you look at some documentation and sample queries to understand the query structure. As somebody with a heavy SQL and data querying background, the language is quite intuitive and powerful.
1
2
3
4
5
6
7
ContainerLog
| join kind = inner (KubePodInventory
| project ContainerID, PodName=Name, ControllerKind, ControllerName, Namespace
| distinct *
) on ContainerID
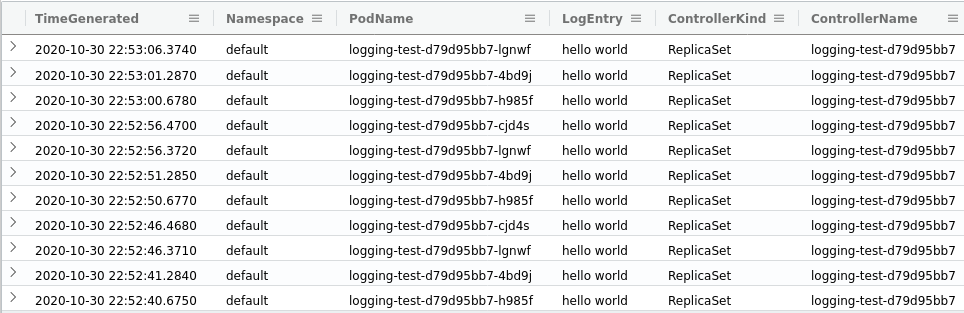
| project TimeGenerated, Namespace, PodName, LogEntry, ControllerKind, ControllerName
| sort by TimeGenerated desc
By joining the ContainerLog table with the KubePodInventory table, we’re able to see what pods have logged what messages.
My output in Azure Data Explorer looks like this:
Summary
This blog post has showed how you can go from a new AKS cluster to querying container logs with this Azure solution. Once you understand these few basic concepts, it is easy to setup and consume!