OpenTelemetry has become the gold standard of cloud-native observability. It is the platform that handles the three observability signals: Traces, metrics, and logs. Metrics are an especially interesting one, though. Metrics, and their consumption, are certainly not new to the world of observability. Prometheus has been around for quite some time now, and its adoption is nothing short of widespread.
OpenTelemetry knows this and embraces Prometheus metrics. While you are free to implement metrics the OpenTelemetry way, that definitely doesn’t mean you should give up on the Prometheus way. In fact, it’s unlikely that you have the bandwidth to rewrite all of your metric implementations in your software (who has time for that?).
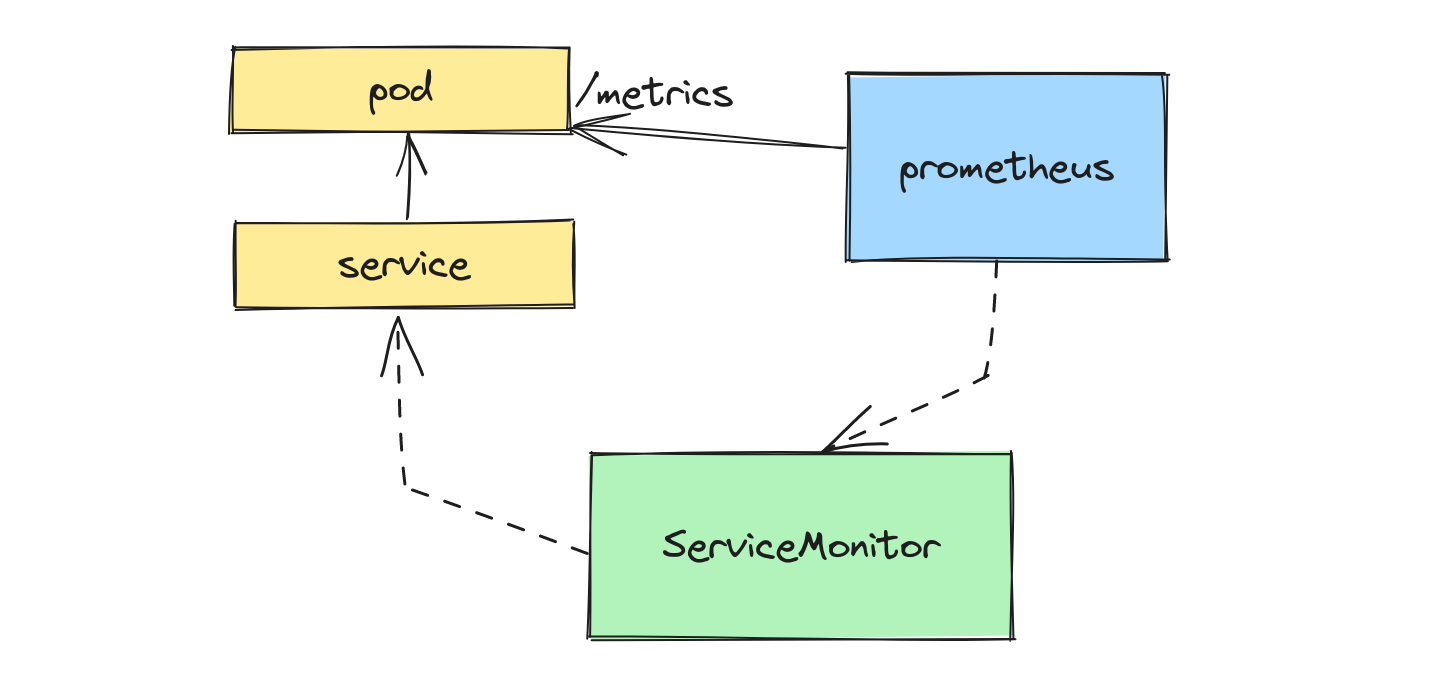
Setting aside OpenTelemetry for a moment and focusing on a common Prometheus implementation, a really big helper in the Kubernetes metrics world is the Prometheus operator, which allows you to define Prometheus Custom Resources and dramatically simplify Prometheus scrape config. Here’s a small example of what this could look like with a ServiceMonitor:
But let’s say you want to start using OpenTelemetry instead to ingest your metrics? OpenTelemetry doesn’t ask you to throw away this approach, thankfully.
You can continue to expose Prometheus metrics from your applications and exporters! 🎉 The way that OpenTelemetry handles ingestion is through a very important component called the OpenTelemetry Collector. The collector can receive Prometheus metrics by specifying a similar config. But what if you wanted to use the Prometheus operator’s custom resources, like ServiceMonitor and PodMonitor, to configure scraping? After all, this makes Prometheus metrics in a Kubernetes cluster much easier.
OpenTelemetry provides a component with the collector called the Target Allocator, which can take ServiceMonitor and PodMonitor CRs and supplement the collector’s Prometheus ingestion. Here’s how this looks now:
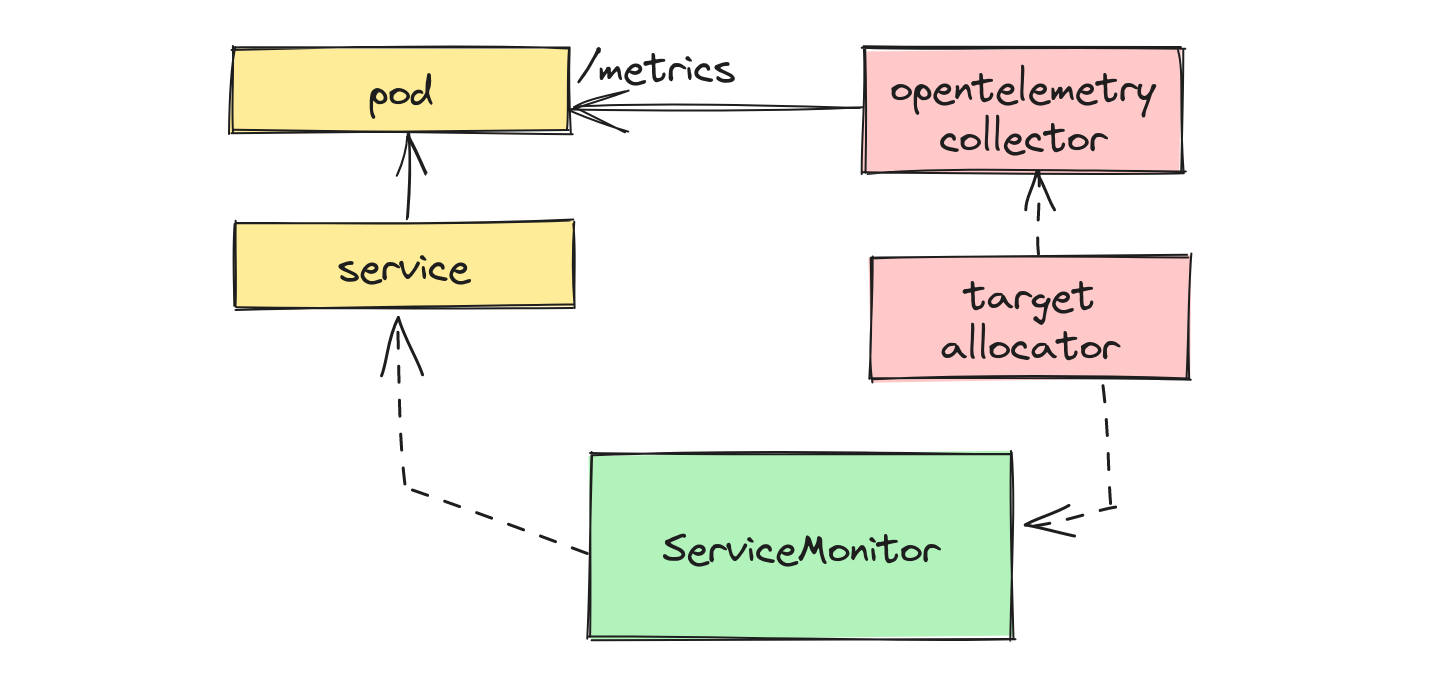
Instead of using Prometheus, we’re now using the OpenTelemetry collector to scrape our metrics. The target allocator knows how to read and handle Prometheus operator CRs, and supplements the Prometheus receiver’s configuration to get the metrics.
TLDR solution
Let’s say you had a Python application that exposes a Prometheus counter metric some_counter:
1
2
3
4
5
6
7
8
9
10
11
12
13
14
15
16
import random
import time
from prometheus_client import start_http_server, Counter

some_counter = Counter(name="some_counter", documentation="Sample counter")

def main() -> None:
    while True:
        random_sleep_time = random.randint(1, 20)
        print(f"Sleeping for {random_sleep_time} seconds", flush=True)
        time.sleep(random_sleep_time)
        some_counter.inc()

if __name__ == "__main__":
    start_http_server(port=8080)
    main()
Remember, this applications knows nothing about OpenTelemetry. To consume this metric with OpenTelemetry, we’ll define our collector using the very helpful OpenTelemetry operator:
1
2
3
4
5
6
7
8
9
10
11
12
13
14
15
16
17
18
19
20
21
22
23
24
25
26
27
28
29
30
31
32
33
34
35
36
37
38
apiVersion: opentelemetry.io/v1alpha1
kind: OpenTelemetryCollector
metadata:
  name: otelcol
spec:
  mode: statefulset
  targetAllocator:
    image: ghcr.io/open-telemetry/opentelemetry-operator/target-allocator:main
    enabled: true
    serviceAccount: otelcol
    prometheusCR:
      enabled: true
      serviceMonitorSelector:
        app: my-app
  config: |
    receivers:
      prometheus:
        config:
          scrape_configs:
          - job_name: 'otel-collector'
            scrape_interval: 30s
            static_configs:
            - targets: [ '0.0.0.0:8888' ]
        target_allocator:
          endpoint: http://otelcol-targetallocator
          interval: 30s
          collector_id: "${POD_NAME}"

    exporters:
      logging:
        verbosity: detailed

    service:
      pipelines:
        metrics:
          receivers: [prometheus]
          processors: []
          exporters: [logging]
There is a lot going on here, so let’s step through it. We’re creating an instance of the collector that has the target allocator enabled:
1
2
3
4
5
6
7
8
  targetAllocator:
    image: ghcr.io/open-telemetry/opentelemetry-operator/target-allocator:main
    enabled: true
    serviceAccount: otelcol
    prometheusCR:
      enabled: true
      serviceMonitorSelector:
        app: my-app
This sets the following for the target allocator, which is a separate deployment from the collector itself:
- The image, which I needed to use off of
maindue to a bug that isn’t in the latest release yet (likely you can ignore this and just use the default image, but it is helpful to know that you can override this if needed) - The serviceAccount that this target allocator will run under, because it will require additional permissions (see below for the detailed RBAC settings for this service account)
- prometheusCR configuration, which enables and sets a serviceMonitorSelector so that the target allocator knows which
ServiceMonitorresources to watch
Then the collector itself has the prometheus receiver configured:
1
2
3
4
5
6
7
8
9
10
11
      prometheus:
        config:
          scrape_configs:
          - job_name: 'otel-collector'
            scrape_interval: 30s
            static_configs:
            - targets: [ '0.0.0.0:8888' ]
        target_allocator:
          endpoint: http://otelcol-targetallocator
          interval: 30s
          collector_id: "${POD_NAME}"
This tells the collector to scrape itself (which exposes metrics as well), and the target allocator should be used to supplement scrape config. Then we set a single exporter:
1
2
3
    exporters:
      logging:
        verbosity: detailed
This is not what you would do in production, but this is an easy way to see the ingested metrics by just dumping them in the collector’s stdout. Finally, we have to tell the collector to use the prometheus receiver and the logging exporter for metrics:
1
2
3
4
5
6
    service:
      pipelines:
        metrics:
          receivers: [prometheus]
          processors: []
          exporters: [logging]
With this collector setup we can see both the collector and target allocator running in our cluster now:
1
2
3
$ kubectl get po | grep otel
otelcol-collector-0                                      1/1     Running   2 (37m ago)   37m
otelcol-targetallocator-8446ff7f55-9tgxv                 1/1     Running   0             37m
And creating the ServiceMonitor to point at our application’s service:
1
2
3
4
5
6
7
8
9
10
11
12
13
14
apiVersion: monitoring.coreos.com/v1
kind: ServiceMonitor
metadata:
  name: my-app
  labels:
    app: my-app
    release: prometheus
spec:
  selector:
    matchLabels:
      app: my-app
  endpoints:
    - port: prom
      path: /metrics
With this in place, our collector should now be scraping our application metrics! Let’s look in the collector’s logs:
1
2
3
4
5
6
7
8
9
10
11
12
13
14
15
16
17
18
19
20
21
$ kubectl logs otelcol-collector-0
...
Metric #7
Descriptor:
     -> Name: some_counter_total
     -> Description: Sample counter
     -> Unit:
     -> DataType: Sum
     -> IsMonotonic: true
     -> AggregationTemporality: Cumulative
NumberDataPoints #0
Data point attributes:
     -> container: Str(my-app)
     -> endpoint: Str(prom)
     -> namespace: Str(default)
     -> pod: Str(my-app-6b557d48f6-xm4dk)
     -> service: Str(my-app)
StartTimestamp: 2023-07-02 14:20:47.005 +0000 UTC
Timestamp: 2023-07-02 14:58:47.005 +0000 UTC
Value: 226.000000
...
Detailed solution
Here’s a fully-detailed setup of this using a local kind cluster.
Create the kind cluster
Create the cluster with a local registry.
Install dependencies
Here we need to install the Prometheus operator (so we can get the ServiceMonitor and other CRs):
1
$ helm install prometheus prometheus-community/kube-prometheus-stack
We have to install cert-manager for the OpenTelemetry collector:
1
$ kubectl apply -f https://github.com/cert-manager/cert-manager/releases/download/v1.12.0/cert-manager.yaml
And then finally we will install the OpenTelemetry operator:
1
$ kubectl apply -f https://github.com/open-telemetry/opentelemetry-operator/releases/latest/download/opentelemetry-operator.yaml
Sample application
Let’s now create our demo application to expose a Prometheus metric. First we’ll create and activate the virtual environment:
1
2
$ python3 -m venv venv
$ . venv/bin/activate
And then install the Prometheus client:
1
$ pip install prometheus-client
And now we need to save these dependencies in requirements.txt:
1
$ pip freeze > requirements.txt
Then create the application in app.py:
1
2
3
4
5
6
7
8
9
10
11
12
13
14
15
16
import random
import time
from prometheus_client import start_http_server, Counter

some_counter = Counter(name="some_counter", documentation="Sample counter")

def main() -> None:
    while True:
        random_sleep_time = random.randint(1, 20)
        print(f"Sleeping for {random_sleep_time} seconds", flush=True)
        time.sleep(random_sleep_time)
        some_counter.inc()

if __name__ == "__main__":
    start_http_server(port=8080)
    main()
Now we need to create the Dockerfile so we can containizer this:
1
2
3
4
5
6
7
8
9
FROM python:3.10-slim

EXPOSE 8080

WORKDIR /app
COPY ./requirements.txt ./app.py .
RUN pip3 install -r ./requirements.txt

CMD ["python", "app.py"]
Finally let’s build and push this image to the local registry:
1
2
$ docker build -t localhost:5001/otel-prom:latest .
$ docker push localhost:5001/otel-prom:latest
Now we need to deploy the application to the cluster:
1
2
3
4
5
6
7
8
9
10
11
12
13
14
15
16
17
18
19
20
21
22
23
24
25
26
27
28
29
30
31
32
33
34
apiVersion: apps/v1
kind: Deployment
metadata:
  name: my-app
spec:
  replicas: 1
  selector:
    matchLabels:
      app: my-app
  template:
    metadata:
      labels:
        app: my-app
    spec:
      containers:
        - name: my-app
          image: localhost:5001/otel-prom:latest
          imagePullPolicy: Always
          ports:
            - name: prom
              containerPort: 8080
---
apiVersion: v1
kind: Service
metadata:
  name: my-app
  labels:
    app: my-app
spec:
  selector:
    app: my-app
  ports:
    - name: prom
      port: 8080
OTel collector
To start scraping, we first need to deploy our collector and the target allocator. But before this, we need to setup a service account and the necessary RBAC so that it can access the resources it needs to:
1
2
3
4
5
6
7
8
9
10
11
12
13
14
15
16
17
18
19
20
21
22
23
24
25
26
27
28
29
30
31
32
33
34
35
36
37
38
39
40
41
42
43
44
45
46
47
48
49
50
51
52
53
54
55
56
57
58
59
60
61
62
63
64
65
66
67
68
69
70
71
72
73
apiVersion: v1
kind: ServiceAccount
metadata:
  name: otelcol
---
apiVersion: rbac.authorization.k8s.io/v1
kind: ClusterRole
metadata:
  name: opentelemetry-targetallocator-cr-role
rules:
- apiGroups:
  - monitoring.coreos.com
  resources:
  - servicemonitors
  - podmonitors
  verbs:
  - '*'
---
apiVersion: rbac.authorization.k8s.io/v1
kind: ClusterRoleBinding
metadata:
  name: otelcol-prom
subjects:
  - kind: ServiceAccount
    name: otelcol
    namespace: default
roleRef:
  kind: ClusterRole
  name: opentelemetry-targetallocator-cr-role
  apiGroup: rbac.authorization.k8s.io
---
apiVersion: rbac.authorization.k8s.io/v1
kind: ClusterRole
metadata:
  name: opentelemetry-targetallocator-role
rules:
- apiGroups: [""]
  resources:
  - nodes
  - nodes/metrics
  - services
  - endpoints
  - pods
  verbs: ["get", "list", "watch"]
- apiGroups: [""]
  resources:
  - configmaps
  verbs: ["get"]
- apiGroups:
  - discovery.k8s.io
  resources:
  - endpointslices
  verbs: ["get", "list", "watch"]
- apiGroups:
  - networking.k8s.io
  resources:
  - ingresses
  verbs: ["get", "list", "watch"]
- nonResourceURLs: ["/metrics"]
  verbs: ["get"]
---
apiVersion: rbac.authorization.k8s.io/v1
kind: ClusterRoleBinding
metadata:
  name: otelcol-discovery
subjects:
  - kind: ServiceAccount
    name: otelcol
    namespace: default
roleRef:
  kind: ClusterRole
  name: opentelemetry-targetallocator-role
  apiGroup: rbac.authorization.k8s.io
And now we can deploy our collector and target allocator:
1
2
3
4
5
6
7
8
9
10
11
12
13
14
15
16
17
18
19
20
21
22
23
24
25
26
27
28
29
30
31
32
33
34
35
36
37
38
apiVersion: opentelemetry.io/v1alpha1
kind: OpenTelemetryCollector
metadata:
  name: otelcol
spec:
  mode: statefulset
  targetAllocator:
    image: ghcr.io/open-telemetry/opentelemetry-operator/target-allocator:main
    enabled: true
    serviceAccount: otelcol
    prometheusCR:
      enabled: true
      serviceMonitorSelector:
        app: my-app
  config: |
    receivers:
      prometheus:
        config:
          scrape_configs:
          - job_name: 'otel-collector'
            scrape_interval: 30s
            static_configs:
            - targets: [ '0.0.0.0:8888' ]
        target_allocator:
          endpoint: http://otelcol-targetallocator
          interval: 30s
          collector_id: "${POD_NAME}"

    exporters:
      logging:
        verbosity: detailed

    service:
      pipelines:
        metrics:
          receivers: [prometheus]
          processors: []
          exporters: [logging]
ServiceMonitor
Finally we need to create the ServiceMonitor to point our target allocator to it:
1
2
3
4
5
6
7
8
9
10
11
12
13
14
apiVersion: monitoring.coreos.com/v1
kind: ServiceMonitor
metadata:
  name: my-app
  labels:
    app: my-app
    release: prometheus
spec:
  selector:
    matchLabels:
      app: my-app
  endpoints:
    - port: prom
      path: /metrics
Viewing metrics
With this all setup, you should now be able to view metrics in the logs of your collector! Here’s a good one-liner to see all the metrics that have been collected:
1
2
3
4
5
6
7
8
9
10
11
12
13
14
15
16
17
18
19
20
21
22
23
24
25
26
27
28
29
30
$ kubectl logs otelcol-collector-0 | grep "Name:" | sort | uniq | xsel -b
     -> Name: otelcol_exporter_enqueue_failed_log_records
     -> Name: otelcol_exporter_enqueue_failed_metric_points
     -> Name: otelcol_exporter_enqueue_failed_spans
     -> Name: otelcol_exporter_sent_metric_points
     -> Name: otelcol_process_cpu_seconds
     -> Name: otelcol_process_memory_rss
     -> Name: otelcol_process_runtime_heap_alloc_bytes
     -> Name: otelcol_process_runtime_total_alloc_bytes
     -> Name: otelcol_process_runtime_total_sys_memory_bytes
     -> Name: otelcol_process_uptime
     -> Name: otelcol_receiver_accepted_metric_points
     -> Name: otelcol_receiver_refused_metric_points
     -> Name: process_cpu_seconds_total
     -> Name: process_max_fds
     -> Name: process_open_fds
     -> Name: process_resident_memory_bytes
     -> Name: process_start_time_seconds
     -> Name: process_virtual_memory_bytes
     -> Name: python_gc_collections_total
     -> Name: python_gc_objects_collected_total
     -> Name: python_gc_objects_uncollectable_total
     -> Name: python_info
     -> Name: scrape_duration_seconds
     -> Name: scrape_samples_post_metric_relabeling
     -> Name: scrape_samples_scraped
     -> Name: scrape_series_added
     -> Name: some_counter_created
     -> Name: some_counter_total
     -> Name: up
As you can see, our some_counter is now being collected by OpenTelemetry!